Statistics
|
Available for Ariane Allegro V7 Editions Entry - Starter - Premium - Enterprise
User access Level 1 - Level 2 - Level 3
|
The statistics module is a very powerful monitoring tool of Allegro V7, it is a dedicated section of the back-office recording most of the different interactions between the kiosk and the hotel’s guest. It gives an analytic vision to the hoteliers to manage the solution, look for point of friction in the scenario and if needed part of the scenario to enhance.
The statistics module is accessible in the back office through the left menu under the setup tools menu. This is a very powerful tool to analyze the whole usage of the kiosk in the hotel through different channel. The page is divided into Arrival and Departure and between every different aspect of the kiosk and the check in journey of the guest, from the online pre check in to the check out.
Below is the first overview page of the statistics where the user can find a summary of all the different data channel available in the dashboard.
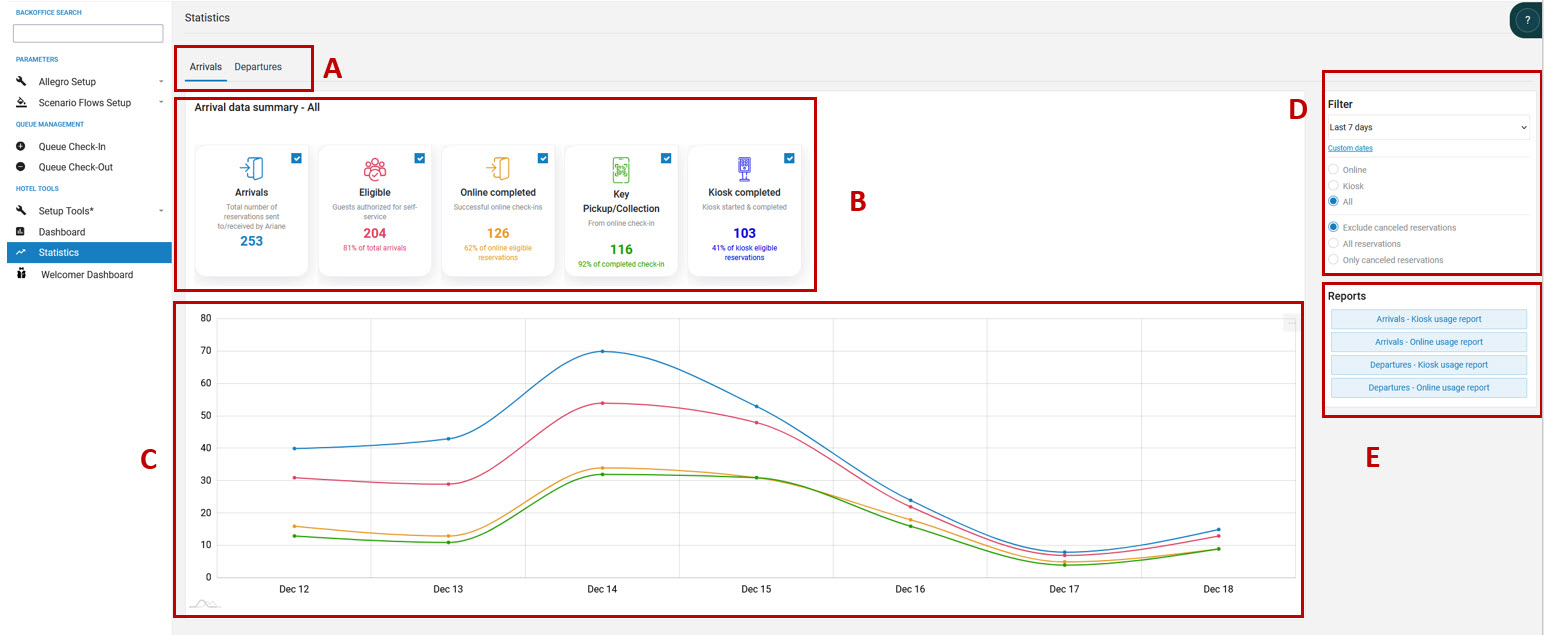
- Selector to choose between Arrival and Departure (A)
- Data summary, it is possible to enable or disable each data channel to look for a targeted data overview (B)
- Data graph using the data form the selected channels on (B), this is a numerical graph displaying the number of reservations over a period. (D)
- The filter selection to choose between Kiosk only, online only or all, the date picker to view data for a specific period, and the ability to exclude cancelled reservations, display every reservation or only the cancelled ones. (D)
- The report downloads section to download detailed reports excel files for arrival or departure and for kiosk or online. (regarding the selected period) (E).
SPECIFIC DATA CHANNELS (ARRIVAL)
All the different data gathered in the statistic portal are chronologically displayed between every section and in the sections as well. They follow the different steps of the guest journey regarding the check in process.
Eligibility
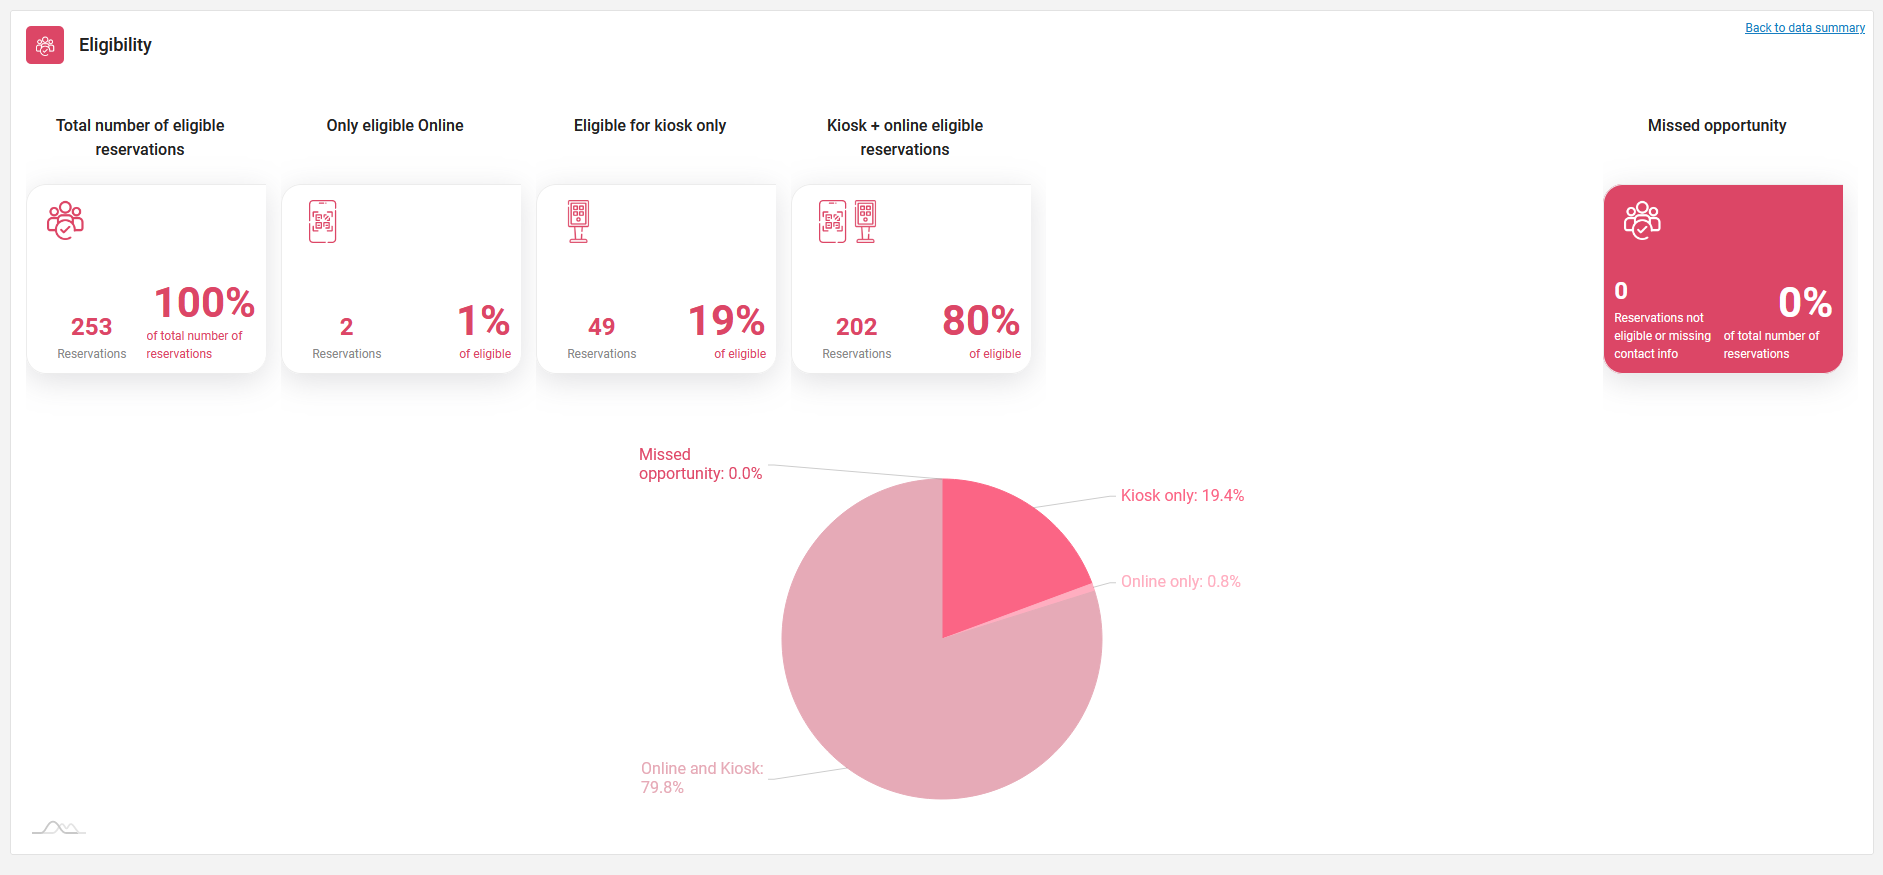
The eligibility section displays the different eligibility status reservation can have regarding the information available in the system and the eligibility criterions on the hotel.
The first tile displays the total number of reservations, and the following ones are displaying specific eligibility statuses on reservation regarding kiosk, online or both. All different percentage are calculated regarding the total number of reservations of the section.
The right darker tile on the screen displays an informative data where the hotel can see the missed opportunity on this section, meaning here the reservation missing information that Ariane couldn’t contact or the ones excluded from the eligibility criterions.
Notifications
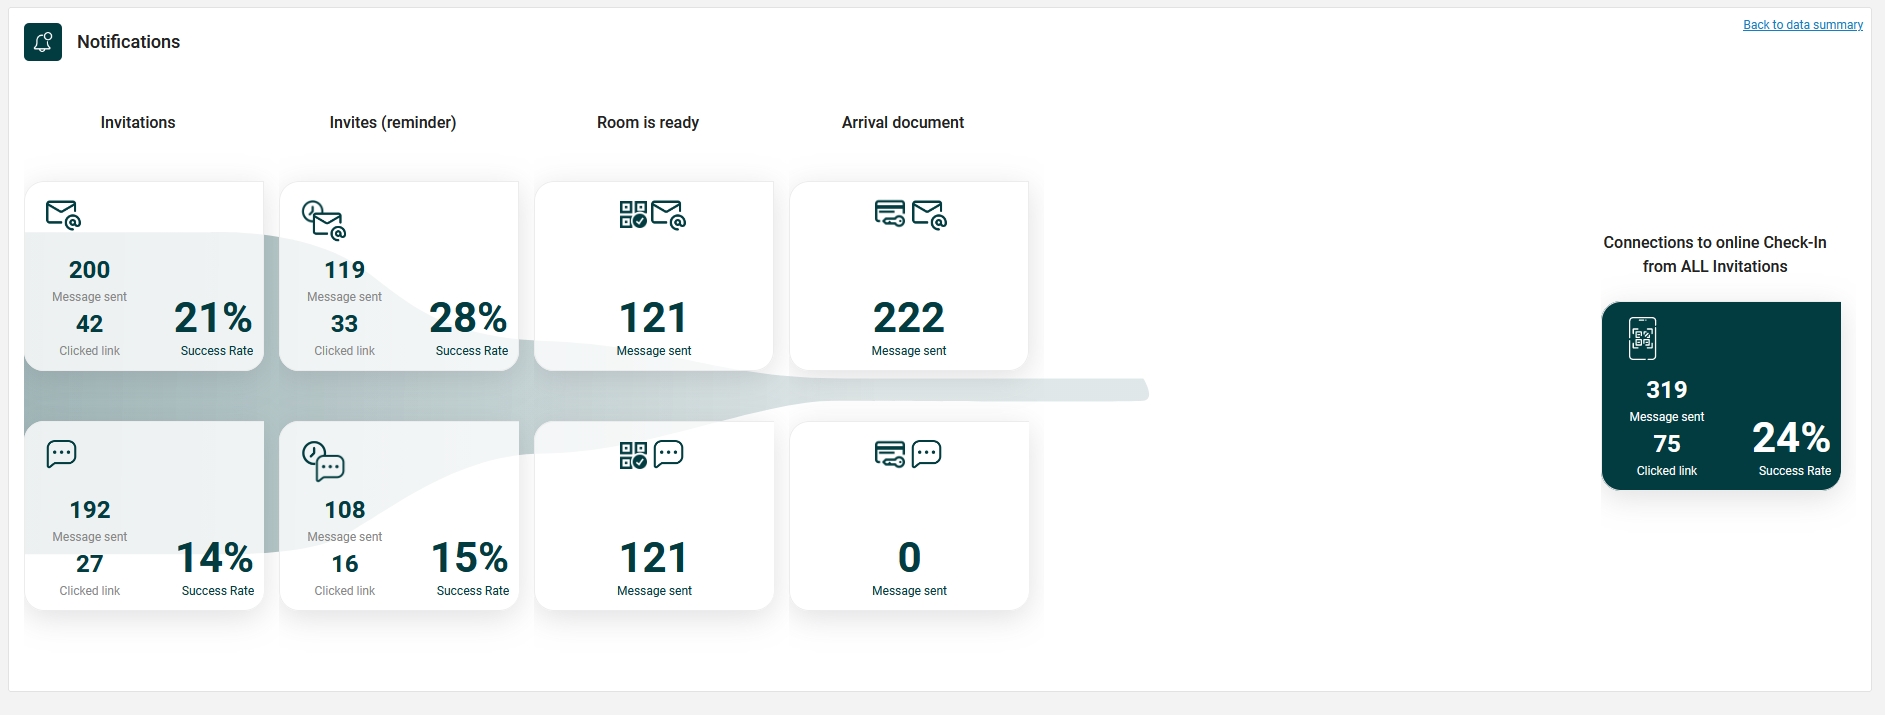
Following the eligibility section comes the notifications where the user can see the different messages sent to the guests. The section is divided in two lines distinguished by a different logo, the top one display messages sent by mail and the bottom one by SMS.
The invitations tiles are divided between the number of messages sent and the number of users which clinked the link in the message. The percentage of success represent the number of guests clicking on the link, a low rate might indicate that the message is not clear enough for the guest.
The two last set of tiles, room is ready and arrival document are related to guests already in the hotel.
The room is ready notifications is sent when a guest comes to the kiosk to get his key and the room is not ready, this reservation becomes a pre-check-in and Ariane sends a “room is ready” message when the room is available for the guest.
The Arrival document is a message configurable in the back office summarizing important information regarding the guest’s stay in the hotel, it is sent once the check in is complete.
Online
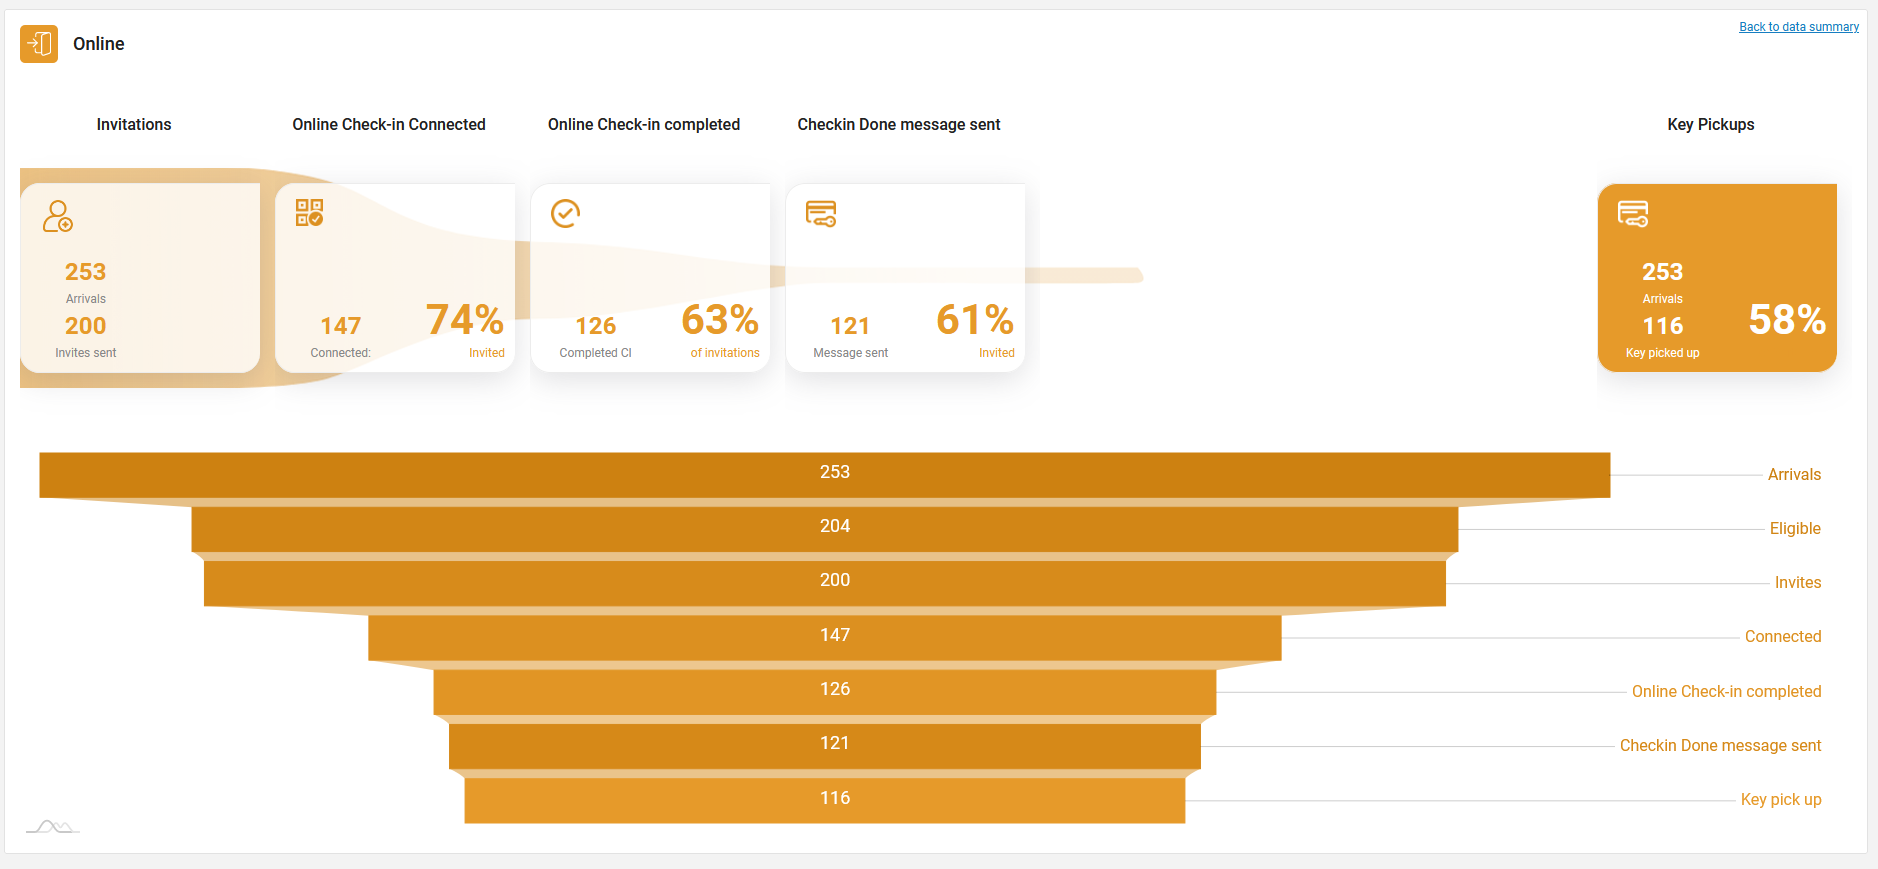
The online section breaks down in different steps the whole online journey of the guest from the invitations to the final notifications sent when the room is ready (check in done message)
This section works as a funnel and the overall objective for the hotel would be to keep as many as possible from the start to the completion of the online journey.
The tiles on the first line displays a chronological data summary form the invitation to the key pick up in the hotel with different major’s steps during the journey:
How many guests connected to the online scenario?
How many completed it?
How many checks in done messages were sent?
How many guests used the key pick up scenario after a successful pre check in?
The bottom top-down funnel display only numerical chronological data following a more precise step by step online journey for the guests. Calculated with the total number of arrival and the number of successful keys pick out the total of arrivals.
Kiosk – additional data

The kiosk section focuses on the usage of the kiosk outside the scope of the online/key pick up journey.
The first tile displays the total number of check-ins started at the kiosk and number of completions, with a percentage of success rate, a low number could indicate that the scenario might be too long or complicated and might need to be adjusted.
The second tile is an informative tile displaying the number of keys encoded at the kiosk through different origins.
The last tile displays the number of “room not ready” reservations at the kiosk, it happens when the guest arrives at the kiosk and no room is available regarding his reservation. (cf: notification section and queue for more information)
The last tile displays the total number of reservation eligible to kiosk check in and the number of completed check-ins.
Walk-in
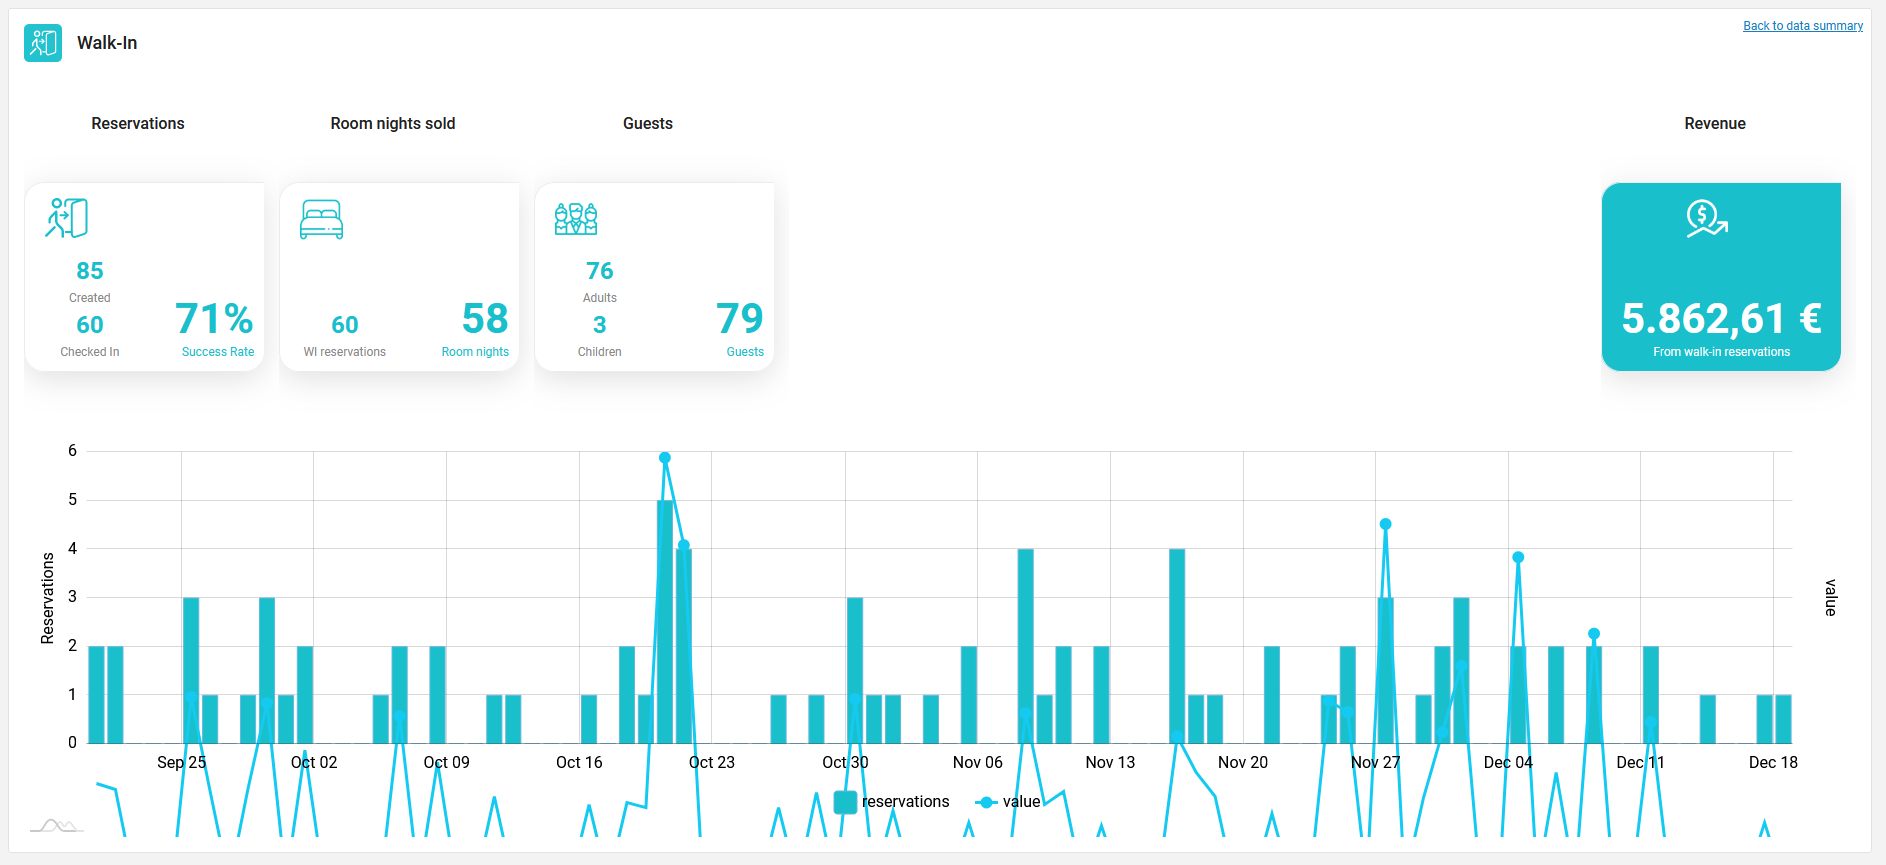
The Walk-in is a special section at the end of the statistics portal, it is only available when the hotel has enabled walk-ins’ scenarios at the kiosk. The walk-in scenario refers to guests coming to the hotel and creating a reservation on the kiosk.
The different tiles show the number of reservations created at the kiosk, the number of nights per room sold, the number of guests and most importantly the total revenue earned via Walk-ins on the selected period.
The graph at the bottom displays the revenue and the number of reservations.
Related Content
No content related
Downloads
English versions:
French versions:
German versions:

-2.jpg?width=229&height=320&name=JurysInn-Belfast-20190124-(2)-2.jpg)


